2011
PWM Entry
What are PWM matrices, and how are they generated?
Position Weight Matrices (PWMs) provide simple representations of the fidelity of recognition and cleavage exhibited by LHEs at each position in their target site. Fidelity can range from being absolute for one base pair identity at a given position (corresponding to a value for 'Information Content' of 1.0 for a single base identity and 0.0 for the other three) to being absolutely nonspecific at a given position (corresponding to values of 0.25 for each of the four possible bases).
For details on the calculation of 'information content' across a protein-DNA recognition site, please refer to Schneider et al. (1986) "Information content of binding sites on nucleotide sequences" J. Mol. Biol. 188 (3): 415 - 431.
Entry of a PWM for a given LHE is based upon experimentally determined and validated specificity profile data for that endonuclease. Once a PWM has been entered for an LHE, that information is available for a PWM-based target search. Typically the data that yields a PWM corresponds to either (1) the relative ability of a given LHE to cleave target sites that harbor individual nucleotide sequence variants at each position, or (2) the relative frequency of nucleotide identities at each position calculated from the output of a selection experiment for cleavable target sites (usually from a partially randomized target site library).
Determination of specificity profiles via systematic measurements of relative cleavability can be done either using either in vitro digests with individual substrates or using yeast surface display combined with DNA staining and cleavage-dependent release, measured by flow cytometry.
For details of either method, see the following two references:
Thyme, S., Takeuchi, R., Jarjour, J., Scharenberg, A., Stoddard, B. L. and Baker, D. (2009) "Exploitation of homing endonuclease binding energy for catalysis and design" Nature 461: 1300 - 1304.
Jarjour, J., West-Foyle, H., Certo, M. T., Hubert, C. G., Doyle, L., Getz, M. M., Stoddard, B. L. and Scharenberg, A. M (2009) "High resolution profiling of homing endonuclease binding and catalytic specificity using yeast surface display" Nuc. Acids Res. 37 (20): 6871-6880.
For determination of a specificity profile using a selection experiment, see the following reference:
Scalley-Kim, M., McConnell-Smith, A. and Stoddard, B. L. (2007) "Coevolution of homing endonuclease specificity and its host target sequence" J. Mol. Biol. 372 (5): 1305 - 1319.
How should individual values be scaled when entering a PWM into the database?
For data that is derived from relative cleavability data (determined using either in vitro digests or via yeast surface display and flow cytometry), the 'most cleavable' nucleotide at each position (usually but not always the wild-type base) should be given a value of '1.0', and all nucleotides at that same position (measured under identical conditions) should be given values scaled between 0.0 and 1.0.
For data that is derived from frequency of recovery in target selection experiments, the frequency of all four basepairs at each position in the data should add up to 1.0. Those frequencies can be entered directly, and will be automatically scaled to produce a comparable PWM.
Example Entry
1. Open the 'Custom PWM Entry' Tool.
Open the 'Custom PWM Entry' Tool by clicking Entry -> Custom PWM Entry. This tool allows you to upload a custom PWM matrix into the relational database for use with the search tool.

The blank form will appear similar to the image below.

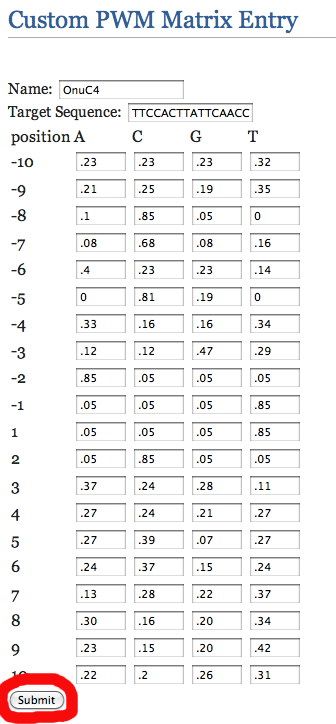
2. Enter in a custom PWM matrix and click Search
In this example, a the I-OnuI matrix is modified increasing the frequency of the wild type nucleotide in the central four positions. Click search after all of the data has been entered.

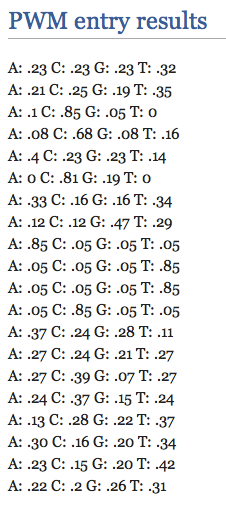
A screen confirming that the matrix has been registered is displayed.
